Promotional banner To Be here.

Field attributes provide Surveyors with the ability to include additional data in their Survey pickup of points. With Stringer Topo V26 users can now include additional data (attribute data) with their COGO points and survey strings for review, editing and output from their drawing.
There are a number of ways to add attributes to your drawing:
Once you’ve added Data Tables, you can easily attach them to objects, review the data for each object and manage all objects with a Data Table assigned. We’ve included mass editing tools and highlight for any disallowed inputs, so it’s easy to manage the attributes ahead of sharing them with your customer.
When it comes to outputs, you can:
Stringer uses Schemas to provide a relational database consisting of Data Tables, Fields, data types and the relationships between these entities.
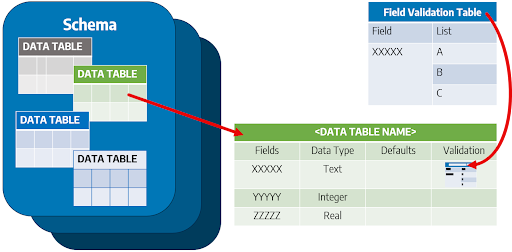
Data Tables within a schema set out the defined Fields (attributes) that can be attached to Objects in the drawing, as well as the allowable inputs for those fields. The Data Table includes the Field name, the Data Type (eg: Text, Integer, Real), a Default value, and an opportunity to set a list of allowable inputs that can be applied (defined by the Field Validator in the software)
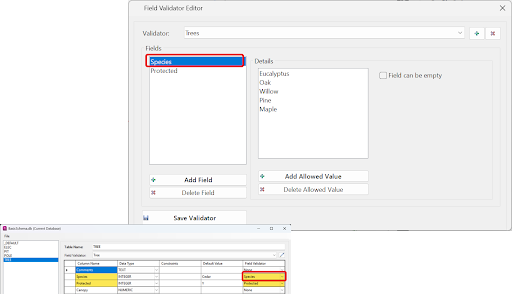
What is a Field Validator? Think of a Field Validator as a list which manages allowable inputs for a Field in a Data Table. These are very useful for fields where there are only certain allowable inputs (such as Y and N) because we’ll highlight any fields containing inconsistent inputs, so you can get this right before you share it with your end customer.
A Schema is considered the ‘blueprint’ of a database which describes how the data may relate to other tables or other data models.
A Schema is added to a Project Database to enable attachment of structured Data Tables to COGO Points and Survey Strings in your drawing.
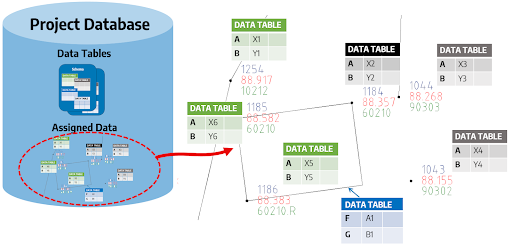
Once a Schema is added to a Project Database, the Data Tables can be edited within that database to manage the Field inputs.
Trimble JXL and Leica XML are common outputs supported by modern Trimble and Leica survey equipment. Trimble JXL and Leica XML files contain attribute data, managed via Data Tables, which can be attached directly to COGO Points and Survey Strings in your drawing.
The Import Trimble JXL and Import Leica XML commands deliver two outputs:
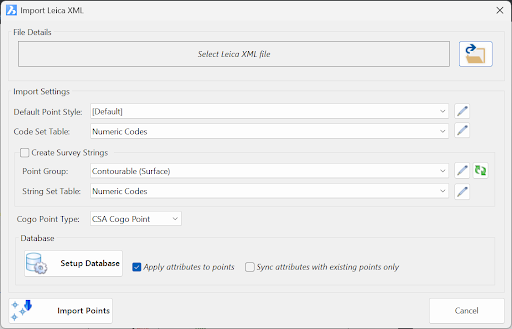
Whilst this command supports the creation of points AND adding the Data Tables, you can instead attach the Data Tables to COGO Points and Survey Strings already in your drawing by ticking on the option ‘Sync attributes with existing points only’.
The JXL/XML import process will create all the Data Tables necessary to support the points picked up in the field, however you can certainly set up a Schema with matching fields and establish allowable field inputs (via the Field Validator) to ensure data compliance.
Even if you don’t work with JXL or XML files, you can still set up a Project Database to attach attribute Data Tables to any COGO Points and Survey Strings in your drawing, and then edit and manage the data fields per object.
Adding a Project Database adds a Schema containing Data Tables and allows attribute data to be attached to and managed for all COGO Points and Survey Strings in your current drawing. If you are planning multiple projects and looking to administer these through the one Project Database, you can set this up by ticking on the Set Database (.db) Location option.
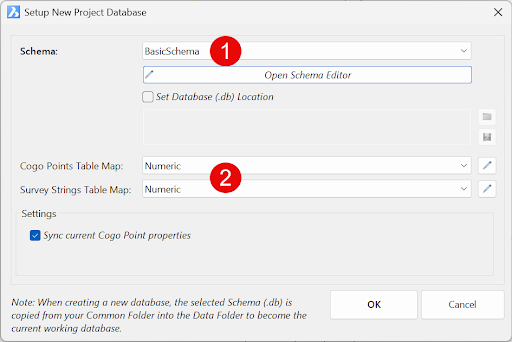
There are two key considerations when creating the Project Database for your drawing:
We’ll cover more on Schemas, Data Tables, Fields and Code Mapping later.
Once attributes have been applied to the drawing objects, you can add, edit and manage the attributed data on an object-by-object basis, or review and edit all attributed objects using the Table Viewer command.
We have a COGO Point Attribute Editor command and Survey String Attribute Editor command to attach, review and edit attribute data.
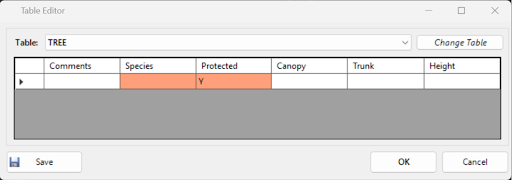
Here, you can change the Data Table assigned to the point/string and you can edit each field individually – just click in a cell and start typing.
Note the highlight – the Species and Protected fields do not match the allowing field inputs. Something to fix! If you click on one of these, you can either type or use the picklist to select an allowable input.
For bulk editing and review of all objects with Data Table fields assigned, use the Table Viewer.
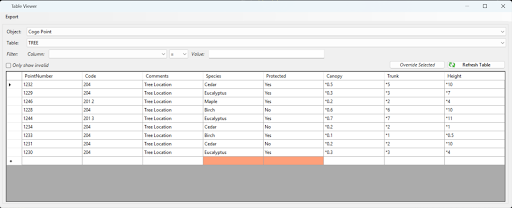
The first thing to do is to pick whether to review the COGO Points or Strings that contain attribute data, then pick the Data Table. You will see all objects referencing that Data Table and all the data inputs assigned to each object.
The filter options will be useful for large data sets when you want to focus on particular field inputs.
You can edit fields individually by clicking on a cell, and you can select multiple fields and click Override Select to edit multiple cells at once. Critically, look for the highlighted cells – these contain invalid data. If you tick on the ‘Only show invalid’ option it will show only those objects that contain invalid data.
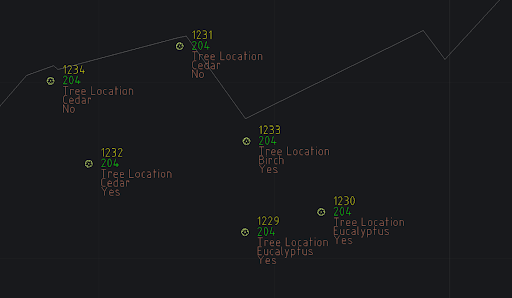
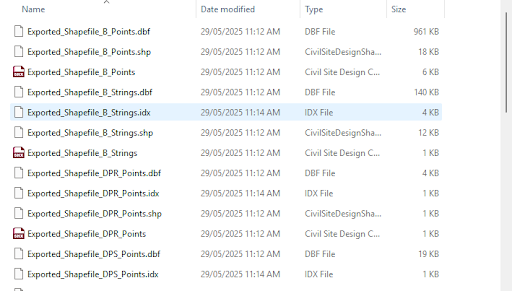
You can use attributed data to create tables (in the drawing or output to file), use attributes to label points and export data to GIS as ESRI .shp files.
If you transfer the Attribute Data across to add Point Properties on each COGO point, you can use the current table outputs from the Point Groups command to include the attribute data fields.
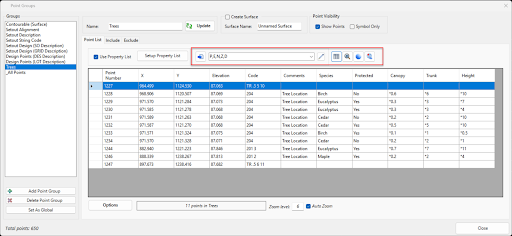

As well, Point Properties can be used directly to label your points.
From the Table Viewer, click on the Export menu dropdown at the top to export each Data Table database out as a CAD table in the drawing, to an Excel .xls file or as a .csv file.
You can use the Export to GIS command to create ESRI .shp files for each Data Table, with a file for the COGO Points and one for the Survey Strings. This is great for sharing to customers looking to include this information into their geospatial environment.
Schemas control the Data Tables and Fields that can be attached to objects in your drawing. COGO Point Table Maps and Survey String Table Maps can automate the attachment of Data Tables to objects in your drawing based on the point Code.
Schemas can be stored outside of your project – these act as a blueprint for how data is managed and can be copied into any current job.
The Schema Editor command provides you with the ability to set up Schemas to include in projects, as well as edit Schema/s you are currently using in a project.
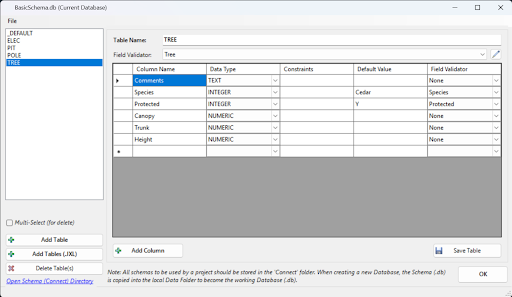
Critically, the Schema includes the Data Tables (left side). You can create, editing and delete Data Tables.
For each Data Table, you can add Columns (Fields), set the Data Type, Default Value and if any field validation (list) is to be applied.
Check out the name of the form at the top – if it shows the Schema name and (Current Database) then you’re editing the schema which is currently applied in your open drawing. If you see the full path to the Schema file, then you’re editing a Schema to act as a ‘blueprint’ for inclusion in a future project.
The Schema Editor form allows you to create, edit and manage Schemas.
Click on that ‘pencil’ button next to the Field Validator picklist to edit the allowing inputs for Fields.
You can make as many Validators as you like. Critically, make sure that the Fields in the Validator match the Data Table field names.
There are two commands to automate the attachment of Data Tables to COGO Points and Survey Strings: COGO Points Table Map and Survey Strings Table Map.
These list Codes set the Data Table to attach if the Point/String Code matches.
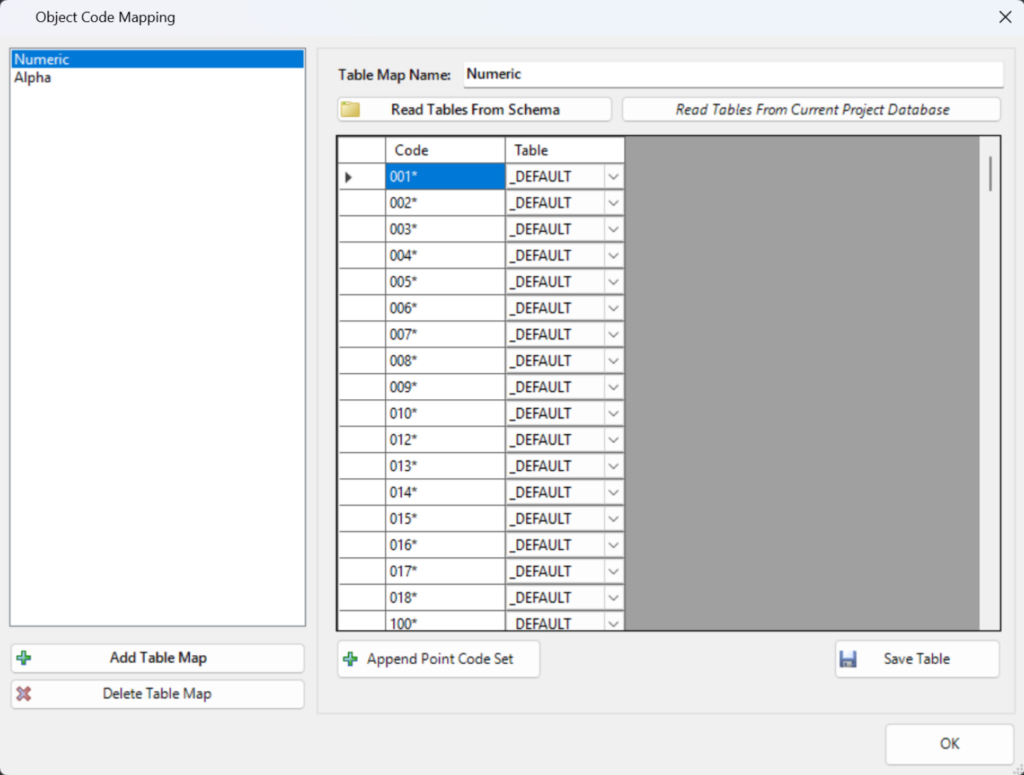
You can always attach Data Tables to any COGO Point or String at any time, but setting up code mapping automates the process.


Copyright Civil Survey Applications 2026 | All Rights Reserved | Website Design by Fox & Lee